Estimated reading time: 6 minutes
You are working on a data visualisation project, but in some instances the data may not be in a format that you want in the output. This is is where a calculated field comes in, it allows you define the output in a way you would like to see it.
So what are calculated fields exactly?
Tableau calculated fields can perform a number of different functions:
- They enable aggregation.
- You can use them to apply filters to your data.
- If you have a need for ratios, they can be used for that.
- Segmenting – return your data in specific segments.
In essence you can define how the output looks by using SQL or logical functions such as if, case, is null etc.
The purpose is that you can control and or define what is output other than what Tableau gives you , as a result the ability to include more detailed analysis based on your understanding of the underlying data is facilitated.
What are the different types of calculated fields?
There are three different types of fields as follows:
1.Basic expressions
Basic expressions allow you on a row basis, to get the data you want out of it. That could be for example finding a specific piece of data or finding the count of the existence of some data you want to analyse.
Here in our raw data , the source data contains 100K records, we have created a calculated field to count this:
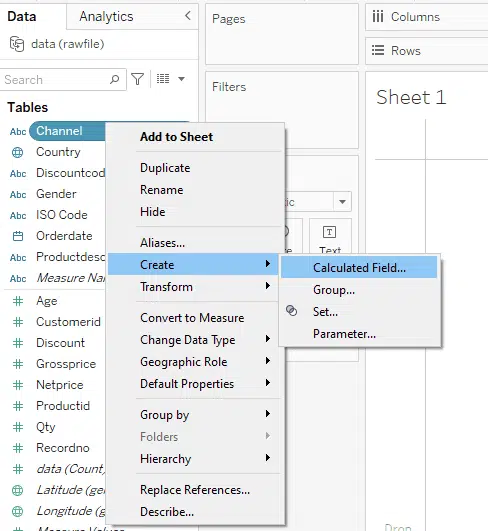
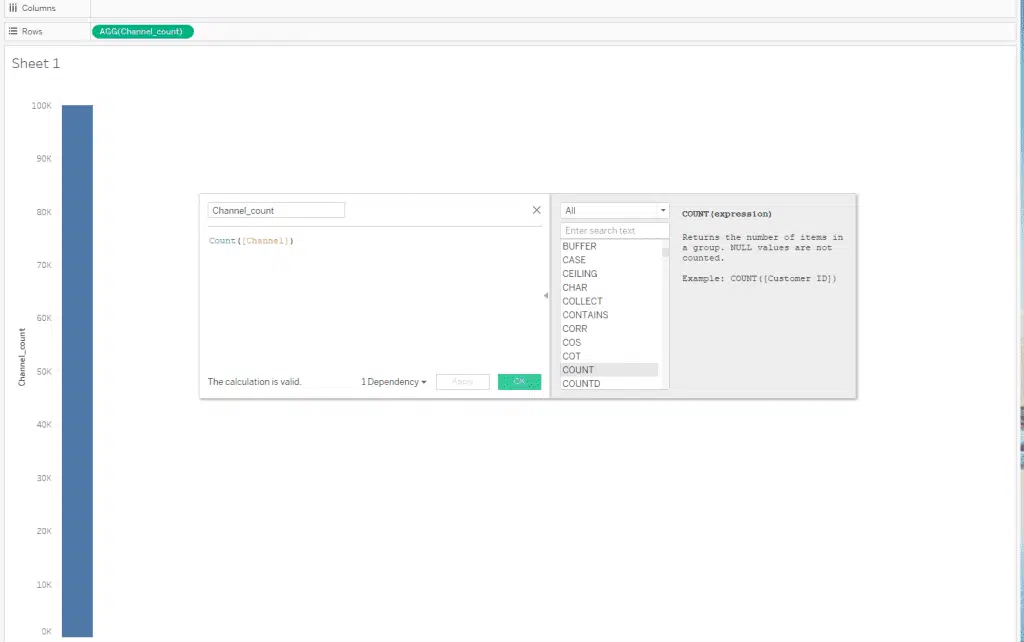
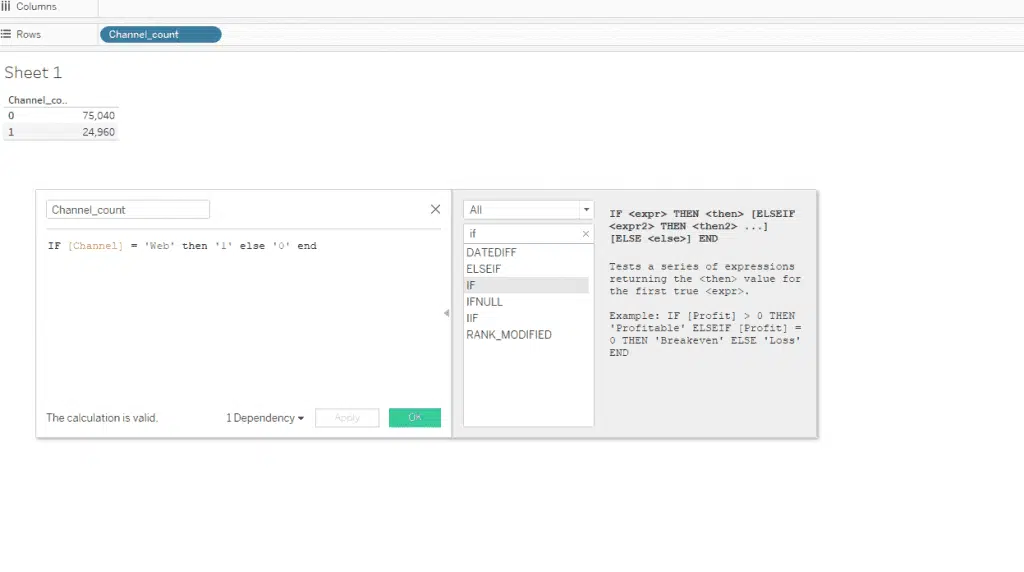
Also we could just count the no of ‘Web’ occurences as follows, and assign a value of 1 to them. This utlisies an “IF STATEMENT”
2. Level of detail ( LOD) expressions
With this you can write expressions that give you more control and allow you to define the granularity you need to be returned.
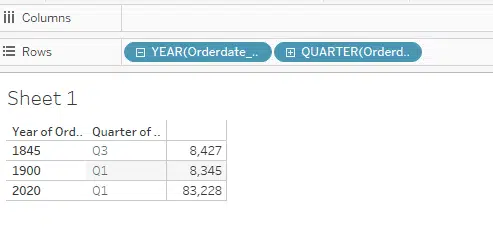
In the below we have started out by year, but in the output it allows the data to be drilled down into:

As can be seen this code summaries up to the year, but in the bar, if you click the + sign beside “YEAR” then it starts to drill down into its lower level data . So the next level will be Quarter:
Then Month:
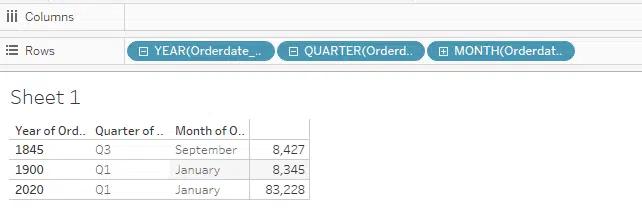
And finally day:

3.Table Calculations
In table calculations, Tableau allows you to create a new column whose output is a calculated value, usually completed by comparing one or more columns.
Some examples you may come across include:
- Month to month or qtr to qtr comparisons.
- Sales comparisons.
- No of new customers comparisons.
In Tableau there is some handy functionality built in which allows quick calculated fields to be shown on the screen.
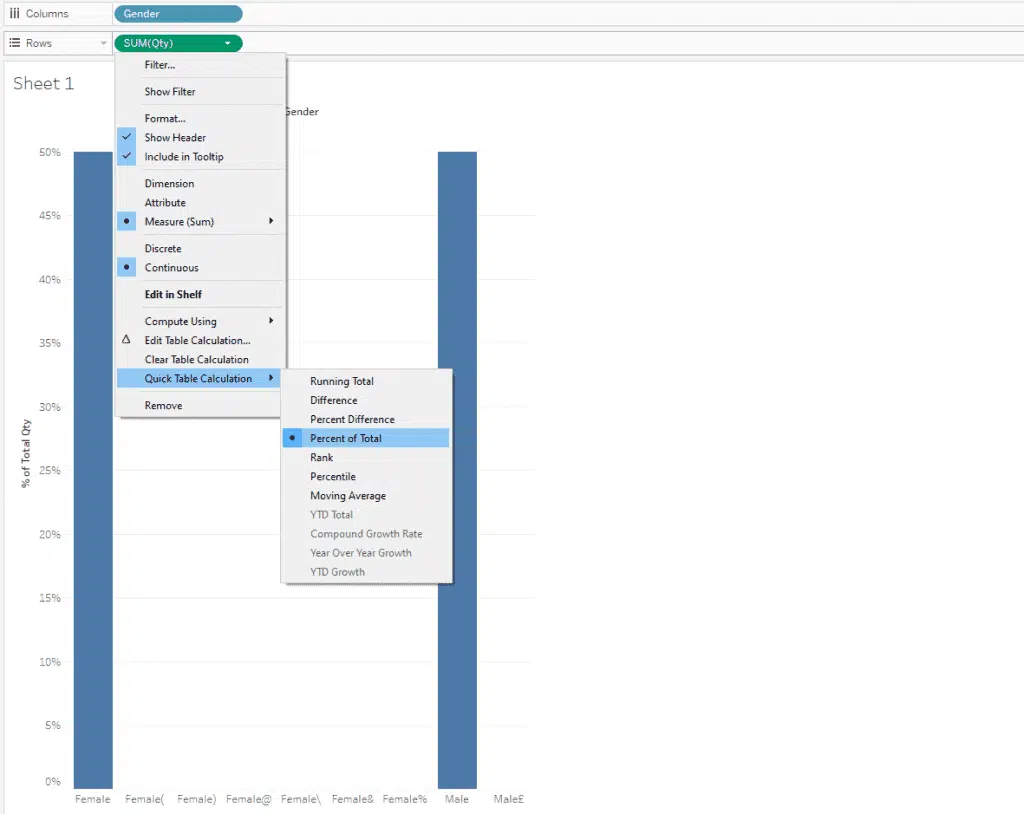
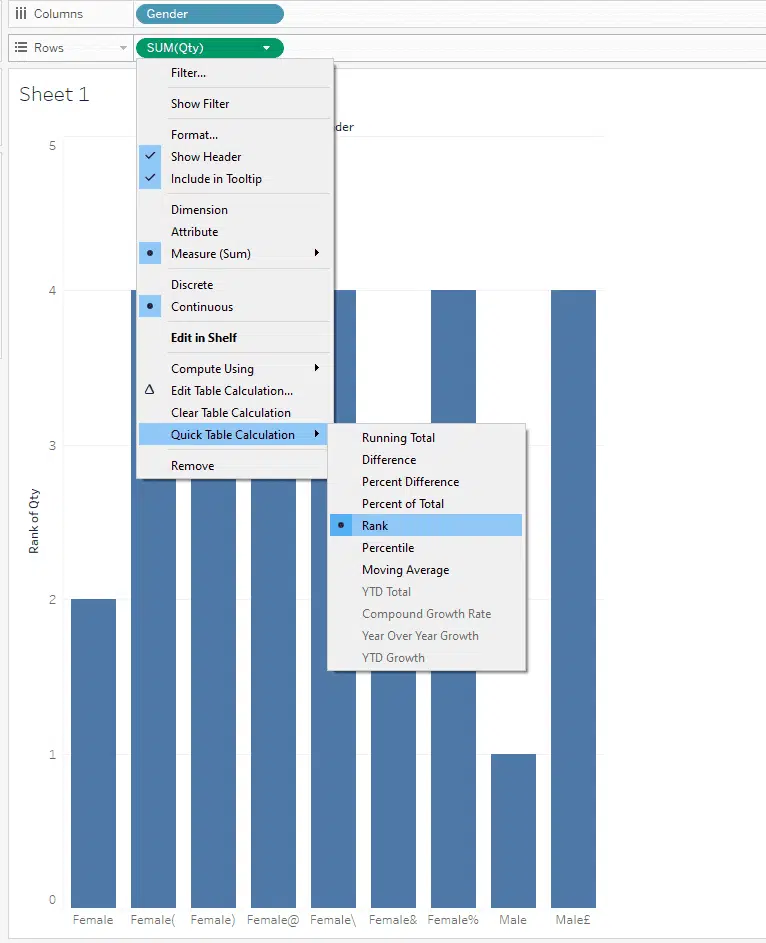
As can be seen if you right mouse click on the shelf , of the data you are analysing, it will allow you to choose what type of table calculation to appear.
In the below we have chosen gender as the dimension to measure, and its percentage split. There is an equal split between male and female.
We could also, split it out by rank.
If you where looking for more functionality , then the following screens could also be used.
You simply Right mouse click on Sum(Qty) in the marks pane, and then edit table calculation.
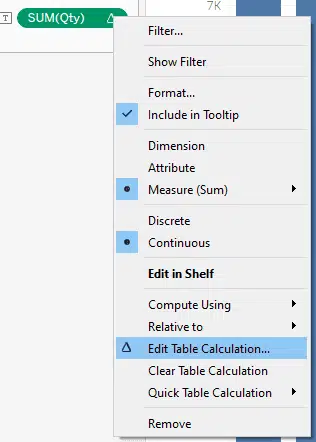
with options:
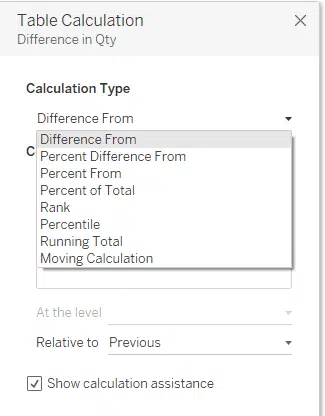
and
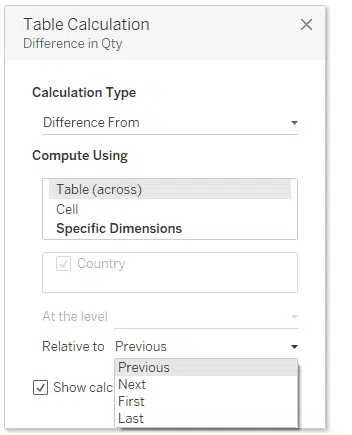
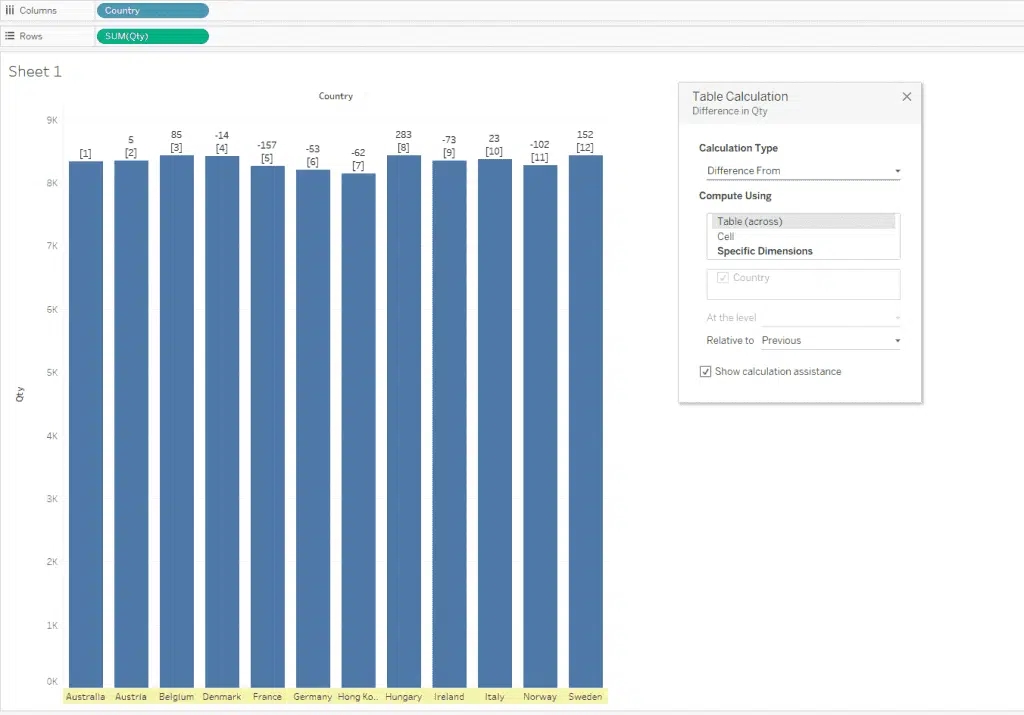
So in summary there are a lot of different ways to create calculated fields, some through the functionality that Tableau has provided, others through writing your own logic.
Note and I have not shown it here, but if you are connected to a database, you can also connect using a custom SQL query. This functionality would only be available in the professional version.
