Skip to content
  • YouTube
  • FaceBook
  • Twitter
  • Instagram

Data Analytics Ireland

Data Analytics and Video Tutorials

  • Home
  • Contact
  • About Us
    • Latest
    • Write for us
    • Learn more information about our website
  • Useful Links
  • Glossary
  • All Categories
  • Faq
  • Livestream
  • Toggle search form
  • How to save data frame changes to a file Python Dataframe
  • How to Pass Python Variables to Javascript Javascript
  • How to import data into excel Python Tutorial
  • IndexError: index 2 is out of bounds for axis 0 with size 2 Index Error
  • how to build a machine learning model machine learning
  • What is a Clustered Index in SQL? SQL
  • how to write subqueries in SQL SQL
  • What does a data analyst do? Livestream

How to group your data in Tableau

Posted on June 27, 2021June 27, 2021 By admin

Estimated reading time: 3 minutes

Have you learnt how to connect to your data in Tableau and now want to understand how to group your Tableau data?

Here we go through a number of steps to help you understand better how to approach this, and what benefits it will bring to your data analytics project.

Why would I group in Tableau?

When you are working with large data sets , sometimes it easier to understand its meaning when the data is stored with simialr data items. Grouping the data has the following benefits:

(A) It allows a quick summary of data, and how large that data set is.

(B) Also groupings can alert to small subsets of data you may have not been aware of.

(C) Another benefit is that groups can be shown that have errors, and fixing them will put them in with the correct data.

(D) You can visually see groups, using Tableau will then you to keep them together.

Grouping by using a field in the data pane

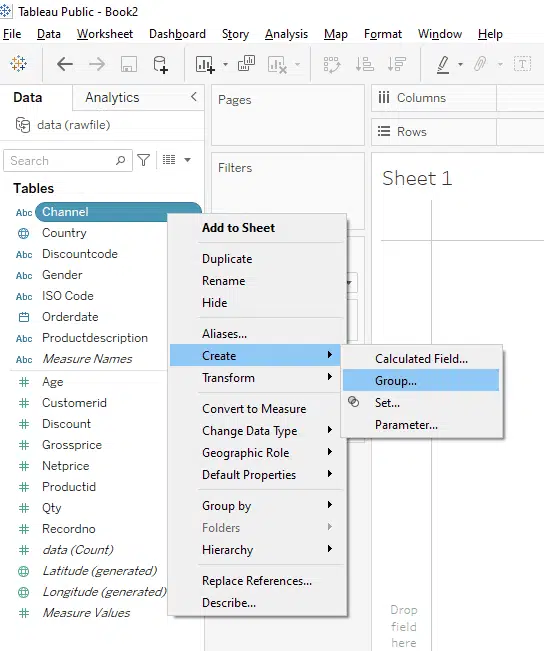
The main way to group is when you are in the data pane, right click on the field you want to group by , then click create group.

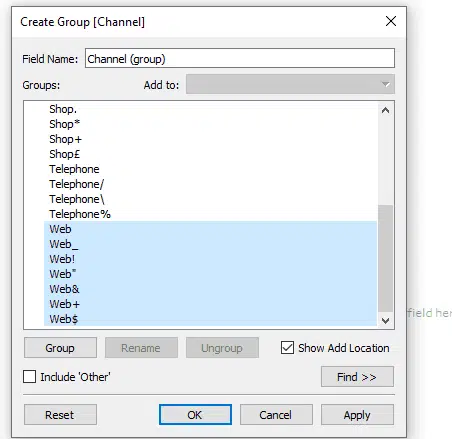
For this example we can choose a number of values within channel, that we want to group by, here we pick all the items that have the value web.

You will notice that even before we click apply, it shows there are some data quality issues around the name that they are not consistent. You could use this to run metrics to catch these problems and count the no that occur.

When they are fixed then these should not appear anymore.

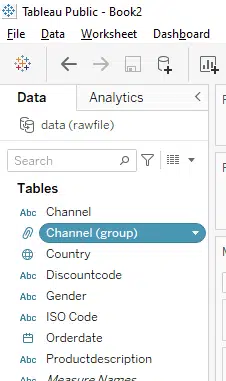
The output of this appears like this:

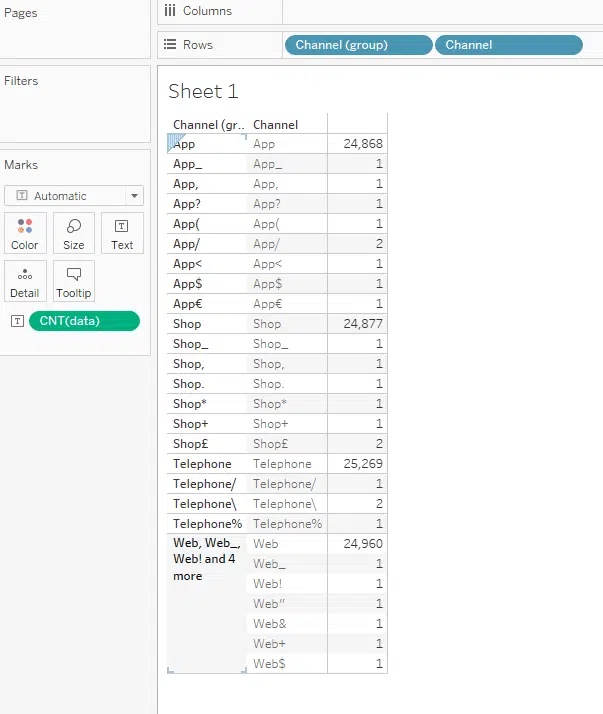
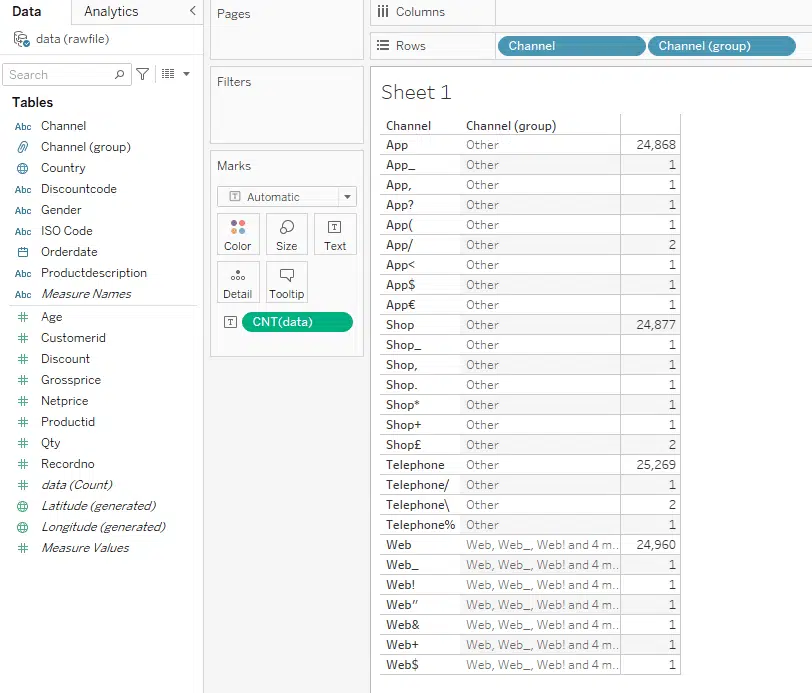
And on the screen , with the grouping now assigned, everything for Channel with web in it, is on one area:

Finally sometimes within your group, you may want an “other” category. The purpose of this is to catch items that dont fall into the group you have assigned, and sometimes they may come in later to the dataset as it expands.

You can achieve this as follows:

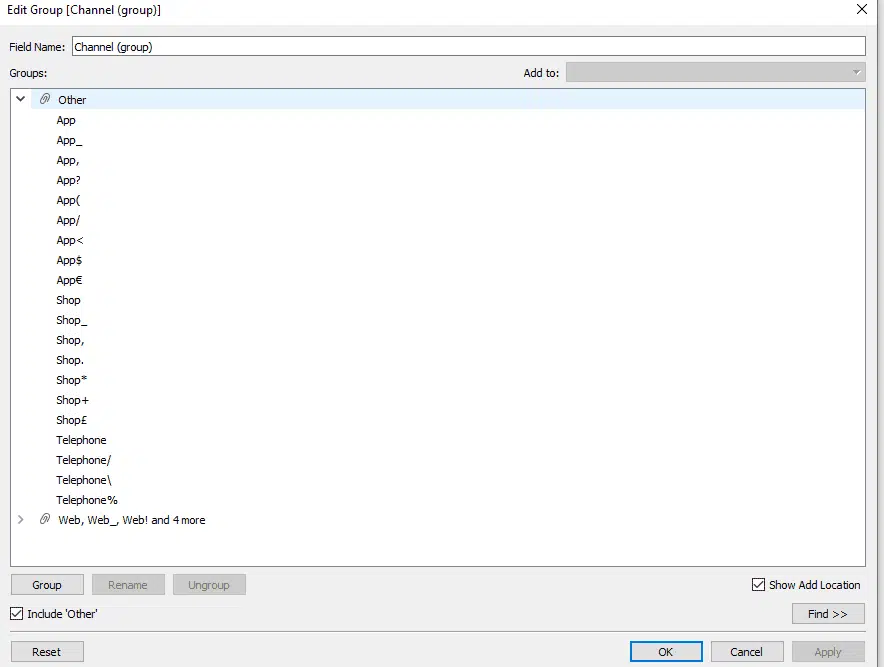
Giving in the output:

So in summary grouping can help you to identify a no of similar items to keep together, and also it is very useful to track data quality items as they arise and are fixed.

data visualisation, Tableau Tags:Data Analysis, Data Analytics, Data Quality, how to connect to your data

Post navigation

Previous Post: How to Compare Column Headers in CSV to a List in Python
Next Post: How to create a calculated field in Tableau

Related Posts

  • How to create a calculated field in Tableau data visualisation
  • What are dimensions in Tableau? data visualisation
  • Tableau Desktop versus Tableau Server data visualisation
  • What are measures in Tableau? data visualisation
  • How can I filter my data in Tableau? data visualisation
  • How to connect to your data in Tableau data visualisation

Select your language!

  • हिंदी
  • Español
  • Português
  • Français
  • Italiano
  • Deutsch
  • how to create an instance of a class class
  • TypeError: cannot unpack non-iterable int object Python
  • How to connect to your data in Tableau data visualisation
  • Tkinter python tutorial Python
  • How to Add Formulas to Excel using Python numpy
  • Python tutorial: Pandas groupby ( Video 1) Python
  • What is the r programming language R Programming
  • What are the reserved keywords in Python Definition

Copyright © 2023 Data Analytics Ireland.

Powered by PressBook Premium theme

This website uses cookies to improve your experience. We'll assume you're ok with this, but you can opt-out if you wish. Cookie settingsACCEPT
Privacy & Cookies Policy

Privacy Overview

This website uses cookies to improve your experience while you navigate through the website. Out of these cookies, the cookies that are categorized as necessary are stored on your browser as they are essential for the working of basic functionalities of the website. We also use third-party cookies that help us analyze and understand how you use this website. These cookies will be stored in your browser only with your consent. You also have the option to opt-out of these cookies. But opting out of some of these cookies may have an effect on your browsing experience.
Necessary
Always Enabled
Necessary cookies are absolutely essential for the website to function properly. This category only includes cookies that ensures basic functionalities and security features of the website. These cookies do not store any personal information.
Non-necessary
Any cookies that may not be particularly necessary for the website to function and is used specifically to collect user personal data via analytics, ads, other embedded contents are termed as non-necessary cookies. It is mandatory to procure user consent prior to running these cookies on your website.
SAVE & ACCEPT