Estimated reading time: 5 minutes
Often a lot of data analytics projects involve comparisons, some of it could be to look at data quality problems, other times it could be to check that data you are loading has been saved to the database with no errors.
As a result of this, there is a need to quickly check all your data is correct. But rather r than do visual comparisons, wouldn’t it be nice to use Python to quickly resolve this?
Luckily for you in this blog post, we will take you through three ways to quickly get answers, they could be used together or on their own.
Let’s look at the data we want to compare
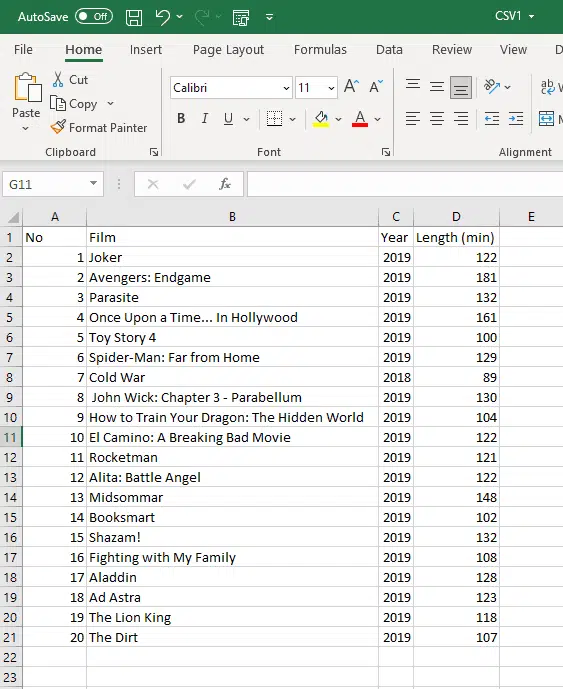
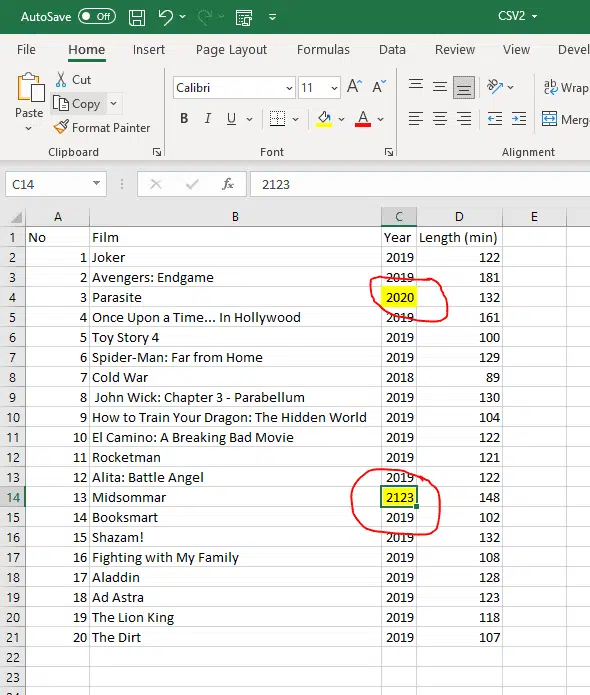
We have two CSV files, with four columns in them:


The objective here is to compare the two and show the differences in the output.
Import the files to a dataframe.
import pandas as pd
import numpy as np
df1 = pd.read_csv('CSV1.csv')
df2 = pd.read_csv('CSV2.csv')
The above logic is very straightforward, it looks for the files in the same folder as the python script and looks to import the data from the CSV files to the respective data frames.
The purpose of this is that the following steps will use these data frames for comparison.
Method 1 – See if the two data frames are equal
In the output for this, it shows differences through a boolean value in this instance “True” or “False”.
array1 = np.array(df1) ===> Storing the data in an array will allow the equation below to show the differences.
array2 = np.array(df2)

df_CSV_1 = pd.DataFrame(array1, columns=['No','Film','Year','Length (min)'])
df_CSV_2 = pd.DataFrame(array2, columns=['No','Film','Year','Length (min)'])

df_CSV_1.index += 1 ===> This resets the index to start at 1 not 0, helps with the output when trying to understand the differences.
df_CSV_2.index += 1

df_CSV_1.index += 1 ===> This resets the index to start at 1 not 0, helps with the output when trying to understand the differences.
df_CSV_2.index += 1

print(df_CSV_1.eq(df_CSV_2).to_string(index=True)) ===> This shows the differences between the two arrays.
Your output will look like this, and as can be seen on lines 3 and 13 are false, these are the yellow values in the CSV2 file that are different to the CSV1 file values, all other data is the same which is correct.
The obvious advantage of the below is that you can quickly what is different and on what line, but now what values are different, we will explore that in the next methods.
        No  Film   Year  Length (min)
1   True  True   True          True
2   True  True   True          True
3   True  True  False          True
4   True  True   True          True
5   True  True   True          True
6   True  True   True          True
7   True  True   True          True
8   True  True   True          True
9   True  True   True          True
10  True  True   True          True
11  True  True   True          True
12  True  True   True          True
13  True  True  False          True
14  True  True   True          True
15  True  True   True          True
16  True  True   True          True
17  True  True   True          True
18  True  True   True          True
19  True  True   True          True
20  True  True   True          True
Method 2 – Find and print the values only that are different
So in the first approach, we could see there are differences, but not what lines are different between the two files.
In the below code it will again look at the data frames but this time print the values from the CSV1 file that have different values in the CSV2 file.
a = df1[df1.eq(df2).all(axis=1) == False] ===> This compares the data frames, but only returns the rows from DF1 that have a different value in one of the columns on DF2

a.index += 1 ===>This resets the index to start at 1, not 0, which helps with the output when trying to understand the differences.

print(a.to_string(index=False))
As a result, the output from this as expected is:
No        Film  Year  Length (min)
  3    Parasite  2019           132
 13  Midsommar   2019           148
Method 3 – Show your differences and the value that are different
The final way to look for any differences between CSV files is to use some of the above but show where the difference is.
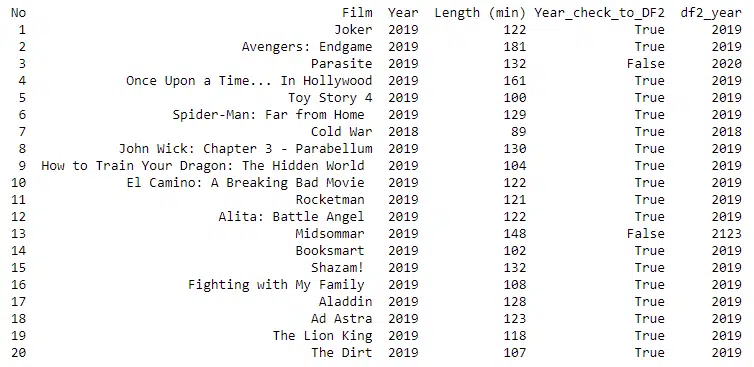
In the below code, the first line compares the two years between the two sets of data, and then applies a true to the column if they match, otherwise a false.
df1['Year_check_to_DF2'] = np.where(df1['Year'] == df2['Year'], 'True', 'False')
df1.index += 1 #resets the index to start from one.

df2_year = df2['Year'] ===> We create this column to store the DF2 year value.
df2_year = pd.Series(df2_year) #Series is a one-dimensional labeled array capable of holding data of any type.

df1 = df1.assign(df2_year=df2_year.values) = This adds the DF2 year value to the DF1 data frame
print(df1.to_string(index=False))
In this instance, this returns the below output. As can be seen, it allows us to complete a line visual of what is different.

So in summary we have completed a comparison of what is different between files.
There are a number of practical applications of this:
(A) If you are loading data to a database table, the uploaded data can be exported and compared to the original CSV file uploaded.
(B) Data Quality – Export key data to a CSV file and compare.
(C) Data Transformations – Compare two sets of data, and ensure transformations have worked as expected. In this instance, differences are expected, but as long as they are what you programmed for, then the validation has worked.

