Skip to content
  • YouTube
  • FaceBook
  • Twitter
  • Instagram

Data Analytics Ireland

Data Analytics and Video Tutorials

  • Home
  • Contact
  • About Us
    • Latest
    • Write for us
    • Learn more information about our website
  • Useful Links
  • Glossary
  • All Categories
  • Faq
  • Livestream
  • Toggle search form
  • Python tutorial: Create an input box in Tkinter Python
  • Python Tutorial: How to sort lists Python Lists
  • Tableau Desktop versus Tableau Server data visualisation
  • How To Fix TypeError: unhashable type ‘slice’ python dictionaries
  • How to create a calculated field in Tableau data visualisation
  • Why choose Julia over other programming languages? Julia programming
  • how to remove unwanted characters from your data R Programming
  • How to Create Multiple XML Files From Excel With Python Python

What are dimensions in Tableau?

Posted on May 14, 2021June 29, 2021 By admin

Estimated reading time: 6 minutes

In our previous post, we showed you how to connect to your data in Tableau. Now that you are in we are going to discuss dimensions and what they can be used for.

What are Dimensions?

When you login to Tableau, you will see the dimensions information on the left hand side as below. We have included the below from our previous post.

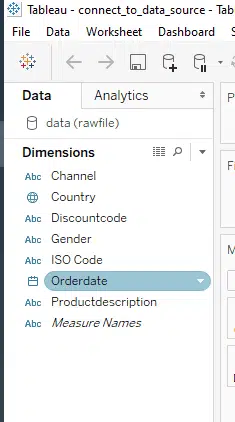
When we talk about dimensions, they are values that contain information that can be measured. So, in other words, you can aggregate them into groups.

Aggregating essentially means you can get summary information on the dimension.

Typical examples of aggregation that could be applied include:

  • Count
  • Sum
  • Minimum
  • Maximum

How do you use dimensions in Tableau?

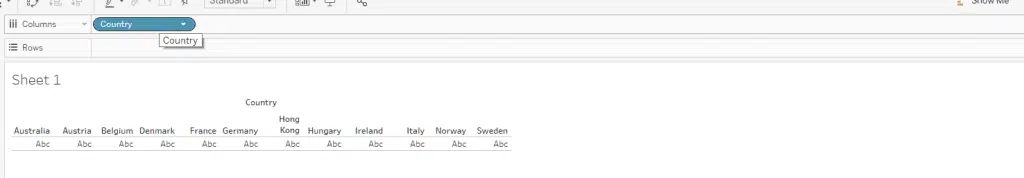
What you can do is drag the dimension over to the column or row values, as per the below:

OR

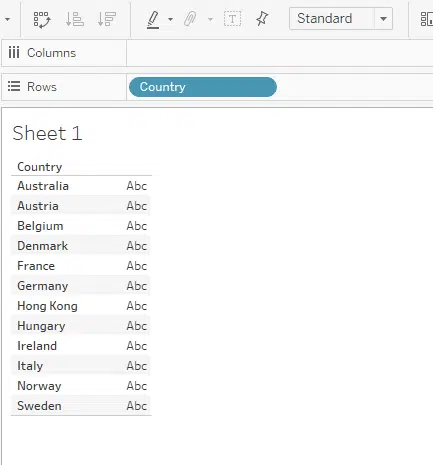
You can then drop additional information into the sheet , to give you more enriched data to analyse. Below we have “Country” in columns and “ISO Code” in rows.

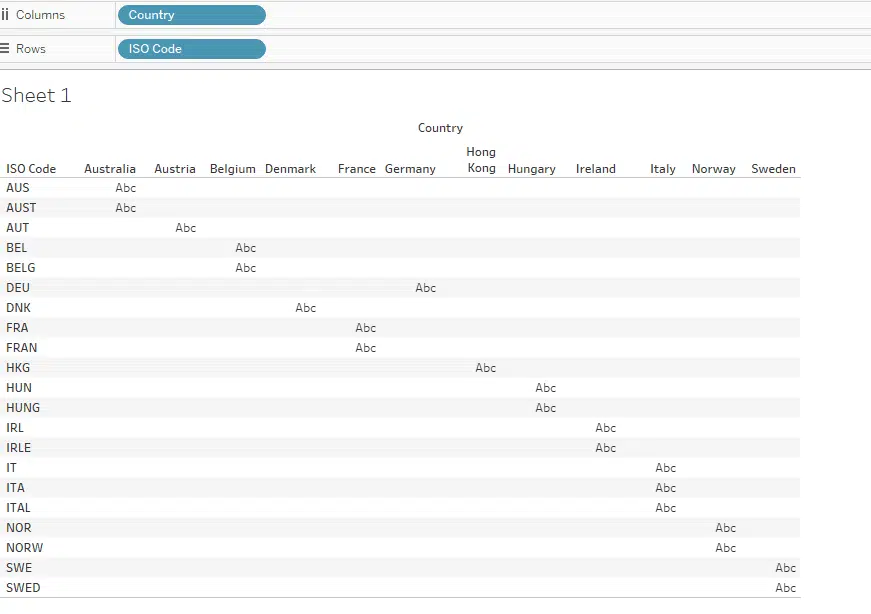
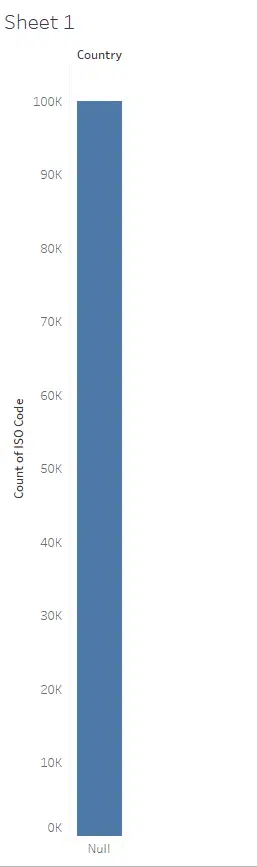
As you will see above there is no actual information that you can use, to make a decision on. The raw file we have pulled this information from which has 100K records in it, can have a count applied against the “ISO code” row field as follows:

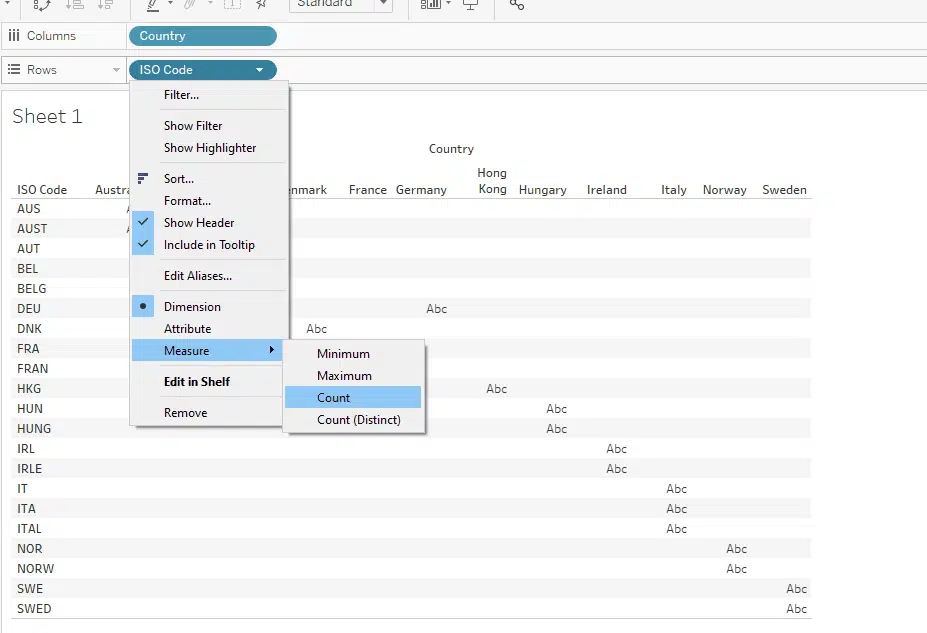
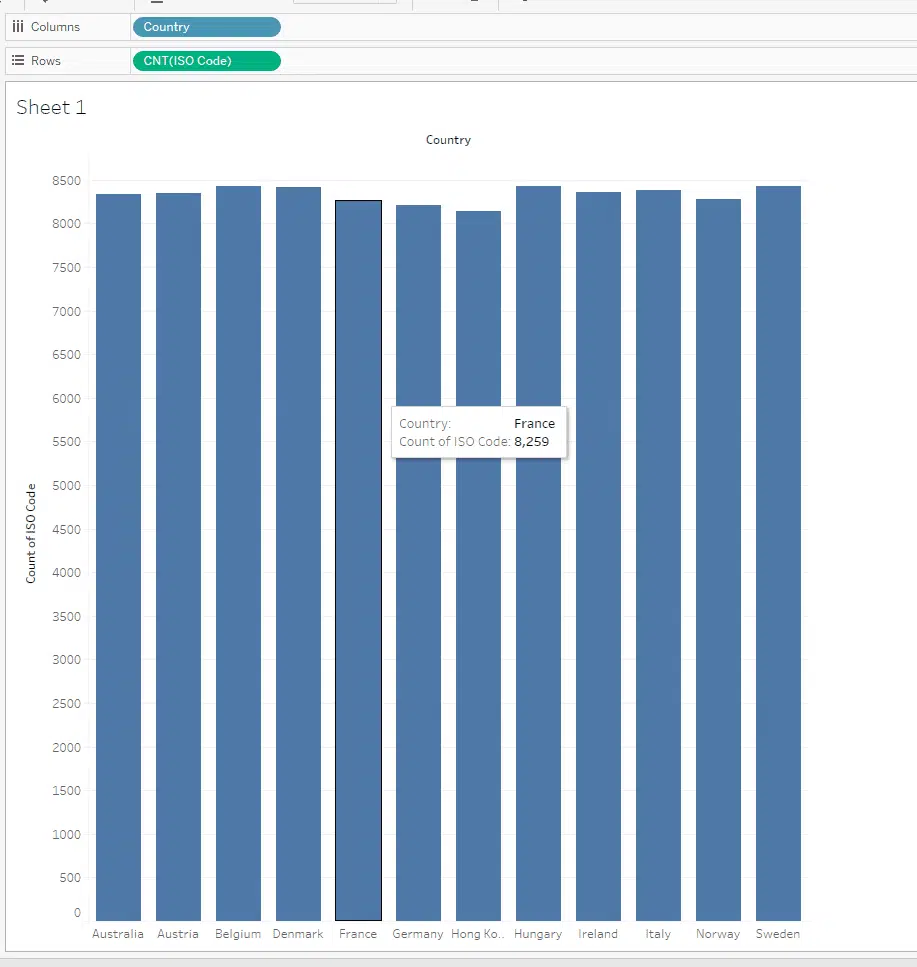
As a result we can now get a better view of the data as follows:

What are the types of things I can with a dimension?

You can change the characteristics of dimensions to get them in a format you would like. Some of the possible ways you could achieve this is:

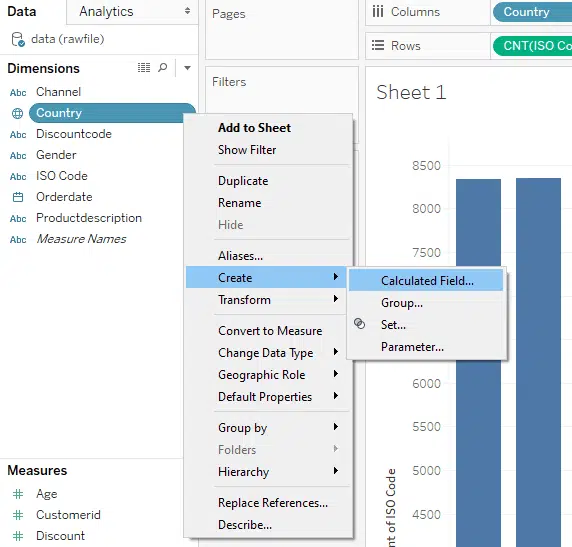
(A) Create a calculated field, this allows you to have additional information that assists better decision making.

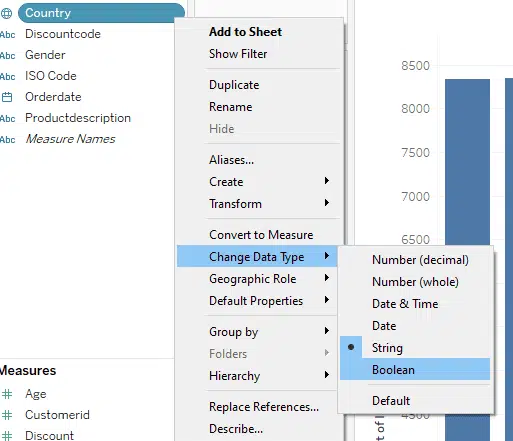
(B) You can change the data type of the field. I would check before doing this as it could have a profound effect on how the data is presented, and not every field may be suited to doing this.

Changing the field ” country” from string to boolean data type as an example, yields the below, which is not very meaningful.

(C) You can change the default properties of the what is presented to you:

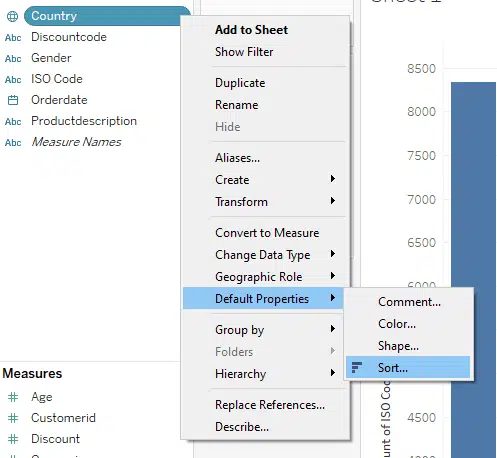
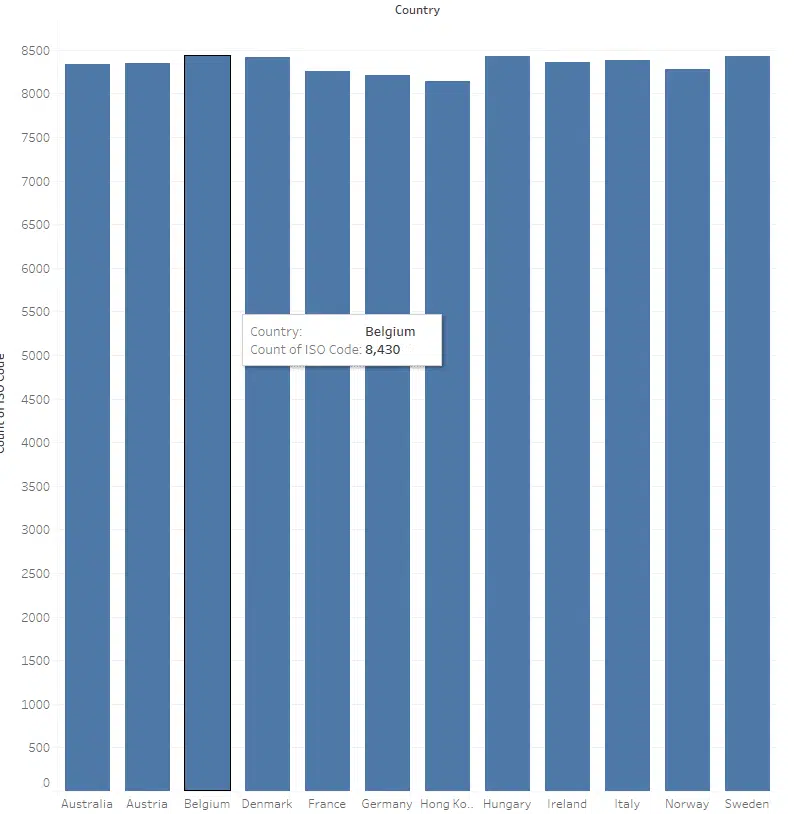
In this scenario, I have sorted “country” ascending, and in alphabetic order

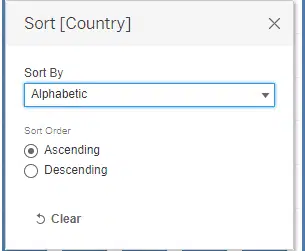
outputting the following:

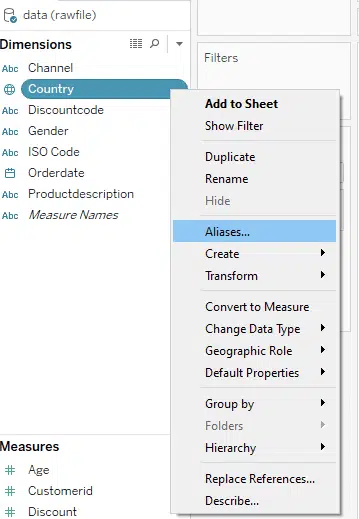
(D) Another option if you so desire is to change the Alias on a field, to a name that is more suitable or meets your needs better.

This can be achieved as follows:

then

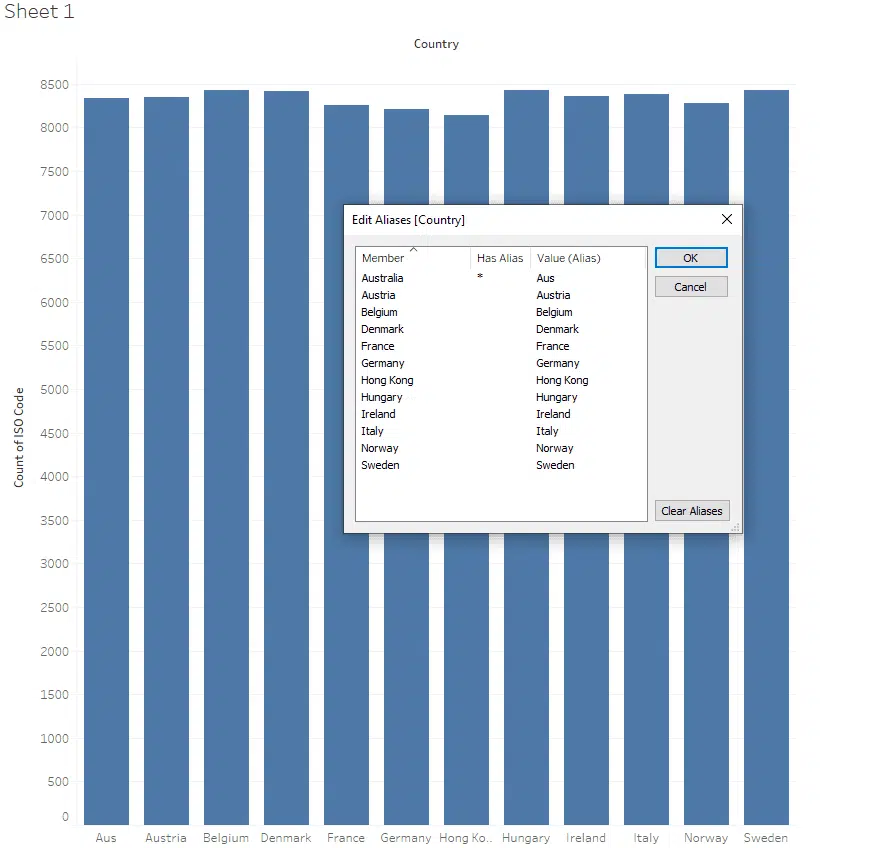
As can been seen from the above, I originally had the first bar as “Australia”, but then changed its alias to AUS.

As a result the chart updated to shows AUS.

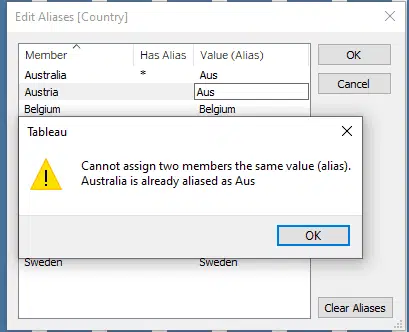
In this scenario changing aliases , you would need to be careful as some names are quite similar, i.e. Australia and Austria

Luckily Tableau has that sorted, as if you do try to do that, you get the following:

You can also see other tableau tips we have written!

data visualisation, Tableau Tags:data visualisation, tableau alias, tableau calculated field, tableau data type, tableau default properties, Tableau Desktop, tableau dimensions, tableau measures

Post navigation

Previous Post: How to add a date when a record is created
Next Post: What are measures in Tableau?

Related Posts

  • How to connect to your data in Tableau data visualisation
  • How to create a calculated field in Tableau data visualisation
  • How can I filter my data in Tableau? data visualisation
  • What are measures in Tableau? data visualisation
  • How to group your data in Tableau data visualisation
  • Tableau Desktop versus Tableau Server data visualisation

Select your language!

  • हिंदी
  • Español
  • Português
  • Français
  • Italiano
  • Deutsch
  • Python Tutorial: How to validate data using tuples Python Tuples
  • how to reverse a string in python strings
  • What is Denormalization of data in a database? Working with databases
  • TypeError: List Indices Must Be Integers Or Slices, Not Tuple exceptions
  • How To Delete a Set of Keys From a Python Dictionary python dictionaries
  • What is Visual Studio Code? Visual Studio
  • how to remove unwanted characters from your data R Programming
  • How To Check For Unwanted Characters Using Loops With Python Python Data Cleansing

Copyright © 2023 Data Analytics Ireland.

Powered by PressBook Premium theme

This website uses cookies to improve your experience. We'll assume you're ok with this, but you can opt-out if you wish. Cookie settingsACCEPT
Privacy & Cookies Policy

Privacy Overview

This website uses cookies to improve your experience while you navigate through the website. Out of these cookies, the cookies that are categorized as necessary are stored on your browser as they are essential for the working of basic functionalities of the website. We also use third-party cookies that help us analyze and understand how you use this website. These cookies will be stored in your browser only with your consent. You also have the option to opt-out of these cookies. But opting out of some of these cookies may have an effect on your browsing experience.
Necessary
Always Enabled
Necessary cookies are absolutely essential for the website to function properly. This category only includes cookies that ensures basic functionalities and security features of the website. These cookies do not store any personal information.
Non-necessary
Any cookies that may not be particularly necessary for the website to function and is used specifically to collect user personal data via analytics, ads, other embedded contents are termed as non-necessary cookies. It is mandatory to procure user consent prior to running these cookies on your website.
SAVE & ACCEPT