Estimated reading time: 3 minutes
You may be working on automating some exports to Excel using Python to compare files or just pure and simple adding formulas to an Excel file before you open it up.
Here we explain adding formulas to your Excel output using Numpy or adding the calculations to specific cells in the output.
Adding formulas to specific cells
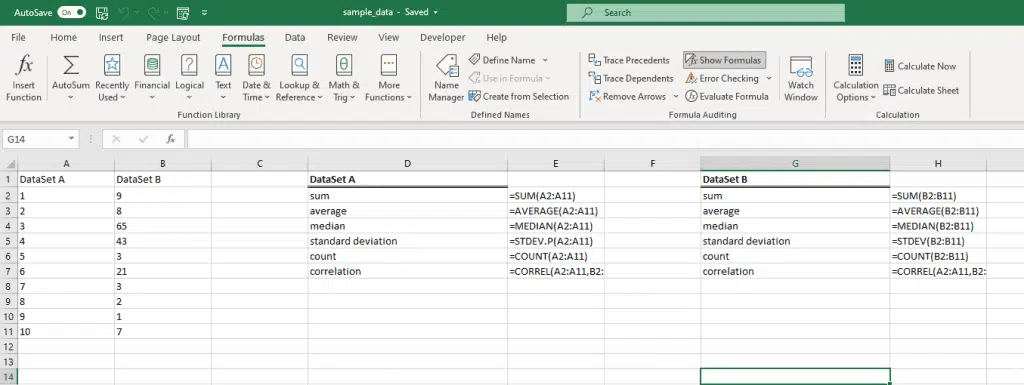
First of all, let’s look at the normal spreadsheet with some calculations, these have the formulas typed in. The ultimate objective is to have the Python code do this for us, one less step.

As can be seen, the cells have the formulas in them, but this would be a very time-consuming process if you had to do it multiple times, in multiple spreadsheets.
To get around this we can write the Python logic as follows:
- Create three lists and three dataframes as follows.
datasetA_list = np.array([1,2,3,4,5,6,7,8,9,10])

datasetB_list = np.array([9,8,65,43,3,21,3,2,1,7])

dataset_list = ('sum','average','median','standard deviation','count','correlation')


datasetA = pd.DataFrame(datasetA_list,columns=['ValueA'])
datasetB = pd.DataFrame(datasetB_list,columns=['ValueB'])
dataset_list_calcs = pd.DataFrame(dataset_list, columns=['Calcs'])
2. Next create a path to where you are going to store the data as follows:
path = 'output.xlsx'3. In this next step create the workbook and location where the data will be stored. This will load the headings created in step 1 to a particular location on the spreadsheet.
workbook = pd.ExcelWriter(path, engine='openpyxl')
workbook.book = load_workbook(path)
workbook.sheets = dict((ws.title,ws) for ws in workbook.book.worksheets)

datasetA.to_excel(workbook,sheet_name="Sheet1", startrow=1,index=False, header=True,)
datasetB.to_excel(workbook,sheet_name="Sheet1", startrow=1, startcol=2,index=False, header=True)
dataset_list_calcs.to_excel(workbook,sheet_name="Sheet1", startrow=1, startcol=4,index=False, header=True)
4. Load the formulas into cells besides their relevant headings. This should line post these formulas beside the relevant heading created in step 1.
###Creating calculations for datasetA

sheet = workbook.sheets['Sheet1']
sheet['E2'] = 'CalcsA'
sheet['F3'] = '=SUM(A3:A12)'
sheet['F4'] = '=AVERAGE(A3:A12)'
sheet['F5'] = '=MEDIAN(A3:A12)'
sheet['F6'] = '=STDEV(A3:A12)'
sheet['F7'] = '=COUNT(A3:A12)'
sheet['F8'] = '=CORREL(A3:A12,C3:C12)'

###Creating calculations for datasetB

sheet = workbook.sheets['Sheet1']
sheet['H2'] = 'CalcsB'
sheet['H3'] = '=SUM(C3:C12)'
sheet['H4'] = '=AVERAGE(C3:C12)'
sheet['H5'] = '=MEDIAN(C3:C12)'
sheet['H6'] = '=STDEV(C3:C12)'
sheet['H7'] = '=COUNT(C3:C12)'
sheet['H8'] = '=CORREL(A3:A12,C3:C12)'
Use Numpy to create the calculations
a. Create the calculations that you will populate into the spreadsheet, using Numpy
a = np.sum(datasetA_list)
b = np.average(datasetA_list)
c = np.median(datasetA_list)
d = np.std(datasetA_list,ddof=1) ## Setting DDOF = 0 will give a differnt figure, this corrects to match the output.
f = np.count_nonzero(datasetA_list)
g = np.corrcoef(datasetA_list,datasetB_list)
b. Create the headings and assign them to particular cells
sheet['E14'] = 'Numpy Calculations'
sheet['E15'] = 'Sum'
sheet['E16'] = 'Average'
sheet['E17'] = 'Median'
sheet['E18'] = 'Standard Deviation'
sheet['E19'] = 'Count'
sheet['E20'] = 'Correlation'
c. Assign the variables in step a to a set of cells
sheet['F15'] = a
sheet['F16'] = b
sheet['F17'] = c
sheet['F18'] = d
sheet['F19'] = f
sheet['F20'] = str(g)
d. Save the workbook and close it – This step is important, and always include.
workbook.save()
workbook.close()
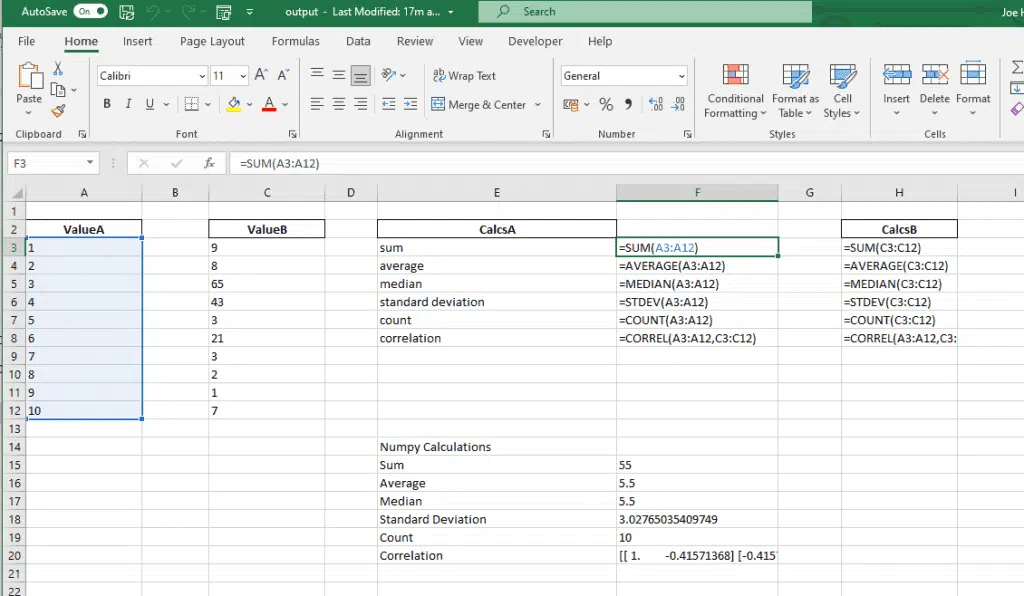
And the final output looks like…


