

Estimated reading time: 5 minutes
So you are using Python and you have data stored in a data frame? You would like to present that on a webpage HTML table, but unsure how to achieve this. Well, read on to see two different methods that will help you.
Pass the data to Javascript which then passes to the HTML the data needed to create the table
In both methods, we are using Python Flask which has an app.py file and HTML files created to present the outcomes.
Step 1 – Read the data and create the data frame
For those familiar with Python Flask, we create the imports that allow us to create the webpage interface to present the data.
Then we create a list called data, which stored the information we need. After this, we create the data frame “df”.
Finally, we create a JSON file,and do some data cleansing.
from flask import Flask, render_template, json
import pandas as pd


app = Flask(__name__)

data = [['Joe','Dublin','100'],['Francois','Paris','100'],['Michael','Liverpool','100']]
df = pd.DataFrame(data, columns = ['Name', 'City','Age'])


json_output = df.to_json()
json_output = json.loads(json_output.replace("\'", '"')) # Removes back slash from JSON generated
Step 2 – Create the output HTML files
Method 1 – Here all this is doing is creating the function to create the webpage “index.html”. Note that name_json=json_output captures the data from step one, and this is what is passed over to the HTML page as a JSON.
In method 2 – We are using to_html which Renders a DataFrame as an HTML table, pure and simple.
As can be seen, it stores the data onto an HTML page that is stored in the templates folder.
#Method 1
@app.route('/')
def index():

    return render_template('index.html', name_json=json_output)

#This is  the start of method 2#
html = df.to_html()
#write html to file
im2_file = open("templates/index_method2.html", "w")
im2_file.write(html)
im2_file.close()

@app.route('/index_method2')
def index_method2():
    return render_template('index_method2.html')


if __name__ == "__main__":
    app.run(debug=True)
Step 3 – Create the HTML tables through javascript
So steps 1 and 2 were getting the data ready so it can be viewed on the web pages, so how are they built?
So let’s walk down through the code, note that a good bit of this is the HTML that is used to present the data on the page.
The first thing to notice is the <style></style> tags. this is for method 1 and applies the boxes around the output.
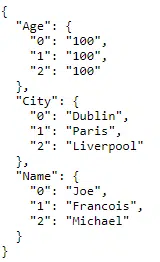
<pre id=”json”></pre> – This line shows the JSON data as follows:
In the below few lines this is the HTML that creates the table to store the data from method 1:
<table id="json_table"> ===> Method 1 table
    <tr>
        <td> Name</td>
        <td> City</td>
        <td> Age</td>
  </tr>
</table>
The next section has the Javascript that will populate both for method 1 and method 2, I will go through it now:
So the first line is creating a variable that references the method 1 table, and where the JSON data will be loaded to.
The second line is converting the JSON into a format that can be read and shown as the “JSON” screenshot above.
In Line 3 & 4, all we are doing here is creating a variable to store the output of the loop that follows in the subsequent lines.
The final set of lines in the script except for the very last line ( which relates to Method 2) catch the data that is captured as part of the loop and feed it to the table that appears on index.html, as follows:

The final line:
window.open(‘http://127.0.0.1:5000/index_method2’, ‘_blank’);
In the Javascript section, this relates to Method 2 and takes the data directly from the app.py file and outputs it to http://127.0.0.1:5000/index_method2.html
This is a very quick and easy way to create the HTML table, and as can be seen, involves less coding than method 1.
<script>
    var selectvalue = document.getElementById("json_table"), test={{ name_json | tojson }}; ===> First line
    document.getElementById("json").textContent = JSON.stringify(test, undefined, 2); ===> Second line

    const keys = Object.keys(test); ===> Line 3
    for (let i = -1; i < keys.length-1; i) ===> Line 4

    {
        const key = keys[i++];

        console.log(key, test[key]);

        a = JSON.stringify(test["Name"][i])
        b = JSON.stringify(test["City"][i])
        c = JSON.stringify(test["Age"][i])
        const tbl = document.getElementById("json_table");
        const row = tbl.insertRow();
        const cell1 = row.insertCell();
        const cell2 = row.insertCell();
        const cell3 = row.insertCell();
        cell1.innerHTML = a;
        cell2.innerHTML = b;
        cell3.innerHTML = c;

    }

    window.open('http://127.0.0.1:5000/index_method2', '_blank');

  </script>
The Full HTML code
<!DOCTYPE html>
<html lang="en">
<head>
  <meta charset="UTF-8">
  <meta name="viewport" content="width=device-width, initial-scale=1.0">

  <title>Document</title>
</head>
<style>
table, td {
  border: 1px solid;
}
</style>
<body>
<pre id="json"></pre>
<div>Method 1 pass the data via JSON to Javascript </div>
<table id="json_table">
    <tr>
        <td> Name</td>
        <td> City</td>
        <td> Age</td>
  </tr>
</table>

  <script>
    var selectvalue = document.getElementById("json_table"), test={{ name_json | tojson }};
    document.getElementById("json").textContent = JSON.stringify(test, undefined, 2);

    const keys = Object.keys(test);
    for (let i = -1; i < keys.length-1; i)

    {
        const key = keys[i++];

        console.log(key, test[key]);

        a = JSON.stringify(test["Name"][i])
        b = JSON.stringify(test["City"][i])
        c = JSON.stringify(test["Age"][i])
        const tbl = document.getElementById("json_table");
        const row = tbl.insertRow();
        const cell1 = row.insertCell();
        const cell2 = row.insertCell();
        const cell3 = row.insertCell();
        cell1.innerHTML = a;
        cell2.innerHTML = b;
        cell3.innerHTML = c;

    }

    window.open('http://127.0.0.1:5000/index_method2', '_blank');

  </script>


</body>
</html>

#how to create a html table from a python dataframe using javascript
The Final output

